In the previous observability articles, we moved through OpenTelemetry for collecting signals, Jaeger for distributed tracing, Falco for runtime security events, and Loki with Grafana for centralized logging. Those signals help engineers understand requests, runtime behavior, and application output. Metrics add another important layer: they tell us whether a system is healthy, how severe a problem is, and whether someone needs to act.
Metrics are not a replacement for logs, traces, or security events. They are usually the fastest way to notice that something changed. After that, logs and traces often explain why it changed, while security events help identify suspicious behavior that may not look like a normal application failure.
This article focuses on Prometheus and Grafana from a practical platform engineering perspective: how metrics are collected, how dashboards help teams reason about service health, and how alerts turn symptoms into operational action.
Recap: Where Metrics Fit in Observability
Observability is easier to use when each signal has a clear job.
Metrics are numeric measurements over time. They answer questions like:
- Is the service available?
- Is latency increasing?
- Are errors rising?
- Is the database connection pool saturated?
- Is the queue backlog growing?
- Is the cluster running out of CPU, memory, or disk?
Traces show the path of a request across services. Logs show application-specific details. Security events show suspicious runtime activity. Metrics tell engineers where to look first.
Metrics
  answer: what changed, how much, how severe
  example: 5xx rate increased from 0.2% to 8%

Traces
  answer: where a request spent time
  example: checkout-api -> payment-api -> payment-provider

Logs
  answer: what the application reported
  example: provider timeout while charging payment method

Security Events
  answer: what suspicious runtime behavior occurred
  example: shell spawned inside production container
A useful incident workflow often starts with metrics. A dashboard or alert shows that latency increased, error rate spiked, or a dependency looks unhealthy. From there, engineers move to traces and logs to understand the request path and application context.
The Problem Metrics Try to Solve
Production systems generate too much activity for humans to inspect manually. In Kubernetes, a backend service may run across many pods, nodes, namespaces, and clusters. Requests may pass through ingress, service mesh proxies, application containers, queues, caches, databases, and third-party APIs.
Without metrics, engineers are often stuck with vague questions:
- Is the service down, or did one customer hit a bad path?
- Is the problem new, or has it been slowly getting worse?
- Is latency high for every request, or only for one endpoint?
- Is the error rate high enough to wake someone up?
- Is the queue catching up or falling further behind?
- Is the database overloaded, or is the application leaking connections?
Metrics turn those questions into time-series data. Instead of asking whether checkout-api feels slow, a team can look at request duration percentiles. Instead of guessing whether failures are widespread, a team can compare error rates by service, route, status code, namespace, or deployment.
The tradeoff is that metrics need careful design. A metric that is too broad hides the problem. A metric with too many labels can overload the monitoring system. A metric that no one knows how to interpret becomes dashboard decoration.
Good metrics should support operational decisions.
What Is Prometheus?
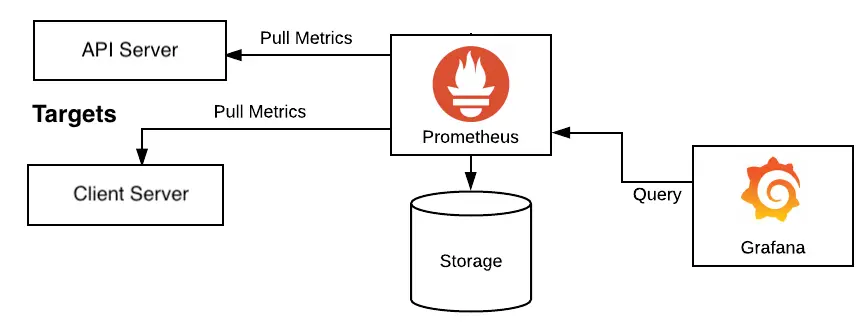
Prometheus is a metrics collection, storage, and query system built around time-series data. It collects numeric samples over time, stores them with labels, and lets engineers query them using PromQL.
In a typical setup, applications and exporters expose metrics over HTTP, usually on a /metrics endpoint. Prometheus periodically scrapes those endpoints and stores the samples in its time-series database.
Application / Exporter
  exposes /metrics
        |
        v
Prometheus
  scrapes metrics periodically
        |
        v
Time-Series Database
        |
        v
PromQL Queries
  dashboards, alerts, investigation
This is different from a push-first model where every application sends metrics directly to a central endpoint. Prometheus normally pulls metrics from known scrape targets. That pull model makes service discovery, target health, and scrape configuration important parts of the platform.
For example, a backend API might expose metrics like:
http_requests_total{service="checkout-api",method="POST",route="/checkout",status="500"} 42
http_request_duration_seconds_bucket{service="checkout-api",route="/checkout",le="0.5"} 1840
db_connections_in_use{service="checkout-api",database="orders"} 38
queue_messages_ready{queue="payment-events"} 1200
Prometheus stores these samples over time. Once the data exists, teams can ask operational questions such as:
- What is the 5xx rate for
checkout-apiover the last 5 minutes? - Did p95 latency increase after the latest deployment?
- Which namespace has the highest CPU throttling?
- Is the worker queue growing faster than consumers can drain it?
- Are database connections close to the configured limit?
What Is Grafana?
Grafana is the dashboard, visualization, and exploration layer commonly used with Prometheus. Prometheus stores and queries the metrics. Grafana helps humans inspect them.
Grafana dashboards can show service health, request rates, latency percentiles, error ratios, resource usage, saturation, queue depth, and dependency behavior. Grafana Explore lets engineers run ad hoc queries when a dashboard is not enough.
Grafana is useful because raw metrics are hard to reason about during pressure. A good dashboard can answer the first few incident questions quickly:
- Is the service receiving traffic?
- Did the error rate change?
- Did latency change?
- Is the issue limited to one route, pod, cluster, or dependency?
- Did resource saturation happen before or after the symptom?
Grafana also helps connect signals. A metric panel can point engineers toward related logs in Loki or traces in Jaeger or another tracing backend. This matters because metrics usually identify the symptom, not the full cause.
How Prometheus and Grafana Fit Together
Prometheus and Grafana are often discussed together, but they have different responsibilities.
Prometheus collects, stores, and queries metrics. Grafana displays and explores those metrics. Alerting may be configured through Prometheus alerting rules, Grafana alerting, or a combination depending on the platform. In many Prometheus-oriented systems, Prometheus evaluates alert rules and sends firing alerts to Alertmanager.
Backend Service
  exposes application metrics
        |
        v
Prometheus
  scrapes, stores, evaluates rules
        |
        +------> Alertmanager
        |         routes notifications
        |
        v
Grafana
  dashboards, panels, exploration
For platform teams, the important point is ownership of the operating model:
- Applications should expose useful metrics.
- Platform components should provide cluster and workload metrics.
- Prometheus should scrape reliable targets and evaluate important rules.
- Grafana should make the data understandable.
- Alertmanager should route actionable alerts to the right place.
The stack works best when it reflects how services actually fail.
Core Concepts
Metrics
A metric is a named measurement. It usually represents something that can be counted, measured, or observed over time.
Common metric types include counters, gauges, histograms, and summaries. At a practical level:
- Counters go up over time, such as total requests or total errors.
- Gauges can go up or down, such as memory usage or queue depth.
- Histograms group observations into buckets, such as request durations.
- Summaries also describe distributions, but histograms are often easier to aggregate across instances in Prometheus.
For service health, teams often start with the RED method:
- Rate: how many requests are happening?
- Errors: how many requests are failing?
- Duration: how long do requests take?
For infrastructure and dependencies, teams often look at saturation:
- CPU usage and throttling
- Memory usage
- Disk usage and IO
- Database connection pool usage
- Queue backlog
- Thread pool or worker pool usage
These measurements help engineers distinguish between a symptom and a capacity problem.
Labels
Labels are key-value pairs attached to metrics. They make metrics queryable by dimensions such as service, route, status code, namespace, pod, cluster, or environment.
For example:
http_requests_total{
  service="checkout-api",
  namespace="payments",
  method="POST",
  route="/checkout",
  status="500"
}
Labels are powerful because they let engineers slice the same metric many ways. The same request counter can answer questions by service, route, status code, namespace, or cluster.
Labels also create risk. Every unique combination of metric name and labels creates a time series. High-cardinality labels can produce too many time series and make Prometheus expensive or unstable.
Avoid labels that can have unbounded values:
user_idemailrequest_idtrace_id- raw URL paths with IDs, such as
/orders/938475 - error messages with dynamic text
Prefer bounded labels:
servicenamespaceroutemethodstatusclusterenvironment
Cardinality is not a theoretical concern. A single bad label can multiply storage, memory usage, query cost, and alert evaluation time. For platform engineers, label governance is part of operating Prometheus safely.
Scrape Targets
A scrape target is an HTTP endpoint Prometheus reads on a schedule. Applications, exporters, and platform components expose metrics. Prometheus discovers those targets and scrapes them.
The endpoint is commonly /metrics.
Prometheus scrape interval: 15s

Target: checkout-api:8080/metrics
  -> request current metric samples
  -> parse Prometheus text format
  -> store samples with labels and timestamp
  -> mark target up or down
The scrape model creates a useful operational signal: Prometheus can tell whether a target is scrapeable. If up{job="checkout-api"} becomes 0, Prometheus could not scrape that target. That does not always mean the service is down, but it means monitoring visibility is broken or the endpoint is unreachable.
In Kubernetes, Prometheus commonly discovers targets through service discovery, annotations, ServiceMonitor resources, PodMonitor resources, or another operator-specific configuration model.
Exporters
Not every system exposes Prometheus metrics natively. Exporters bridge that gap. An exporter collects metrics from a system and exposes them in Prometheus format.
Common examples include:
node-exporterfor Linux node metrics such as CPU, memory, filesystem, and network.kube-state-metricsfor Kubernetes object state such as deployments, pods, replicas, and node conditions.- Database exporters for PostgreSQL, MySQL, Redis, and other data stores.
- Message broker exporters for systems such as RabbitMQ or Kafka.
In Kubernetes, exporters help platform teams see the health of the platform, not just the application.
Kubernetes Cluster
  |
  +-- Application Pods
  |     expose /metrics
  |
  +-- node-exporter
  |     exposes node metrics
  |
  +-- kube-state-metrics
  |     exposes Kubernetes object state
  |
  +-- database / queue exporters
        expose dependency metrics

Prometheus
  scrapes all configured targets

Grafana
  shows service, workload, node, and dependency health
This is where metrics become useful for platform engineering. If checkout-api latency increases, the platform team can check whether the problem aligns with pod restarts, CPU throttling, node pressure, database saturation, or queue backlog.
PromQL
PromQL is the query language for Prometheus. It is used to select, filter, aggregate, and calculate over time-series data.
You do not need to become a PromQL expert on day one. The practical starting point is learning how to:
- Select a metric by name and labels.
- Calculate rates from counters.
- Aggregate by useful dimensions.
- Compare recent behavior with thresholds.
- Build latency percentiles from histograms.
Example ideas:
5xx rate by service:
rate(http_requests_total{status=~"5.."}[5m])

Request rate by route:
sum by (route) (rate(http_requests_total{service="checkout-api"}[5m]))

Database connections in use:
db_connections_in_use{service="checkout-api"}
The exact metric names depend on the application and instrumentation library. The important habit is to query the smallest useful question first. During an incident, a clear query is better than a clever query that no one can explain.
Alerts
Alerts turn metric conditions into notifications. In a Prometheus-oriented setup, Prometheus evaluates alerting rules. When a rule fires, Prometheus sends the alert to Alertmanager. Alertmanager handles grouping, routing, silencing, inhibition, and notification delivery.
Prometheus Rule
  expression: error rate too high for 10 minutes
        |
        v
Prometheus
  evaluates rule on schedule
        |
        v
Alertmanager
  groups, routes, silences, deduplicates
        |
        v
Notification Channel
  on-call, Slack, email, incident tool
Good alerts should be actionable. They should indicate a user-impacting problem, a clear risk, or a condition that needs timely human response.
Weak alerts usually fire on noisy symptoms without context:
- CPU above 80% for one pod for one minute.
- Any single 500 response.
- Any pod restart in any namespace.
- Queue depth greater than zero.
Better alerts consider severity, duration, and impact:
checkout-api5xx ratio above 5% for 10 minutes.- p95 latency above the service objective for 15 minutes.
- Queue backlog growing for 20 minutes while consumers are healthy.
- Database connection pool above 90% for 10 minutes with elevated request latency.
- Prometheus cannot scrape critical targets for several intervals.
The goal is not to alert on every abnormal number. The goal is to notify humans when action is needed.
Practical Example
Imagine a Kubernetes platform running a backend service called checkout-api. It receives checkout requests, calls payment-api, writes orders to PostgreSQL, and publishes messages to a queue for asynchronous fulfillment.
The team has instrumented the service with HTTP metrics, database pool metrics, and queue metrics. Prometheus scrapes application pods and exporters. Grafana has a dashboard for the checkout domain.
One morning, an alert fires:
Alert:
  checkout-api high 5xx ratio

Condition:
  5xx responses are above 5% for 10 minutes

First question:
  Is this isolated, increasing, or already recovering?
The platform engineer opens Grafana and checks the service dashboard.
Metric Alert
  checkout-api 5xx ratio high
        |
        v
Grafana Service Dashboard
  request rate, error rate, latency
        |
        v
Breakdown by route and status
  /checkout has elevated 502 responses
        |
        v
Dependency Panels
  payment-api latency increased
  database pool looks normal
  queue backlog is stable
        |
        v
Logs and Traces
  inspect failing request path and error context
The metrics show that only POST /checkout is affected. Request rate is normal, but p95 latency increased before the 5xx spike. Database connections are below saturation. Queue backlog is not growing. The payment-api dependency panel shows increased latency and timeout errors.
At this point, metrics have narrowed the investigation. They have not fully explained the cause. The engineer then checks traces for slow checkout requests and logs for checkout-api and payment-api during the affected window.
The trace might show:
checkout-api
  POST /checkout
        |
        v
payment-api
  POST /payments/charge
        |
        v
external payment provider
  timeout after 3 seconds
The logs might show that a provider endpoint is timing out for one region or one payment method. Metrics pointed to the symptom and narrowed the blast radius. Traces and logs explained the request path and operational detail.
The same pattern works for other problems:
- A latency increase can point to CPU throttling, a slow dependency, or database contention.
- A queue backlog can show workers are not keeping up with incoming work.
- Database connection saturation can explain rising request latency and timeouts.
- A scrape target going down can show a monitoring gap or unreachable service.
In a healthy observability workflow, metrics are the entry point, not the final answer.
Good Metrics vs Bad Metrics
Good metrics are boring in the best way. They are stable, understandable, bounded, and tied to operational questions.
Bad metrics create noise, cost, or confusion. They may look useful in a dashboard but fail during an incident because nobody knows what action they imply.
Good Metric
  name: http_requests_total
  labels: service, route, method, status
  use: calculate request rate and error ratio
  action: identify affected service and endpoint

Bad Metric
  name: request_failed_for_user
  labels: user_id, email, request_id, error_message
  use: too many unique series
  action: unclear and expensive to query
Good metrics usually have these traits:
- They answer a real operational question.
- They have clear units.
- Their labels are bounded and intentional.
- They can be aggregated across pods or instances.
- They support alerting or investigation.
- They remain useful after deployments and scaling events.
Bad metrics usually have these problems:
- They include high-cardinality labels.
- They duplicate logs as metrics.
- They are too specific to one code path.
- They are not documented or understood.
- They trigger alerts without a clear response.
- They measure internal details that do not affect users or operations.
Metrics should be designed as part of the service contract. A backend API should expose enough information for operators to understand traffic, errors, latency, saturation, and key dependencies. It does not need to turn every variable into a time series.
Things to Watch Out For
The first risk is high cardinality. Prometheus can handle a lot, but it is not magic. Labels such as user_id, request_id, raw path, or dynamic error text can create massive numbers of series. This increases memory pressure, storage usage, query latency, and operational risk.
The second risk is alert fatigue. If every small deviation creates a notification, engineers learn to ignore alerts. Alerts should represent conditions that need action, not every interesting graph movement.
The third risk is dashboard overload. A dashboard with 60 panels may look impressive, but it can slow down incident response. Good dashboards should make the first few questions easy:
- Is traffic normal?
- Are errors elevated?
- Is latency elevated?
- Is saturation visible?
- Is the issue isolated by route, pod, namespace, cluster, or dependency?
The fourth risk is confusing infrastructure symptoms with user impact. High CPU might be acceptable if latency and error rate are healthy. A pod restart might not matter if the deployment remains available. On the other hand, a modest resource increase may matter if it correlates with rising p95 latency or customer-facing errors.
The fifth risk is treating metrics as the whole observability story. Metrics are excellent for detecting patterns and severity. They are weaker at explaining detailed application behavior. When a metric alert fires, engineers usually still need logs, traces, deployment history, and sometimes security events.
Metric
  tells you: checkout-api 5xx ratio is high
        |
        v
Dashboard
  tells you: /checkout and payment dependency look affected
        |
        v
Trace
  tells you: request waits on payment-api call
        |
        v
Log
  tells you: provider timeout for charge operation
        |
        v
Action
  rollback, fail over, adjust timeout, scale worker, or escalate dependency
A mature platform makes this flow easy. The engineer should be able to move from alert to dashboard, from dashboard to logs or traces, and from there to a concrete mitigation.
Closing
Prometheus and Grafana give platform teams a practical way to understand service health. Prometheus collects and queries time-series metrics. Grafana turns those metrics into dashboards and exploration workflows. Alertmanager helps route important conditions to the people who need to respond.
The value is not in having more graphs. The value is in knowing whether a system is healthy, how severe a problem is, and whether action is needed.
Metrics are often the first signal during an incident. They show the shape, timing, and blast radius of a problem. Then logs, traces, and security events help explain the cause and context. Used together, these signals make backend and infrastructure operations less dependent on guesswork and more grounded in evidence.
For a platform engineering team, a good metrics setup should make the next incident simpler to reason about: what changed, who is affected, where to look next, and what action is worth taking.