Observability Series 05: Loki, Logstash, and Grafana — Building a Practical Centralized Logging Pipeline
In the previous observability articles, we looked at the bigger picture of observability, then moved into OpenTelemetry for signal collection, Jaeger for distributed tracing, and Falco for runtime security events. Those tools help us understand how requests move through services and how systems behave at runtime.
Logs are still part of that story.
Metrics tell us that something changed. Traces show us where a request spent time. Security events tell us when suspicious runtime behavior appears. Logs often answer the next practical question: what exactly did the application say when it happened?
This article focuses on a practical centralized logging stack: Loki for log aggregation, Grafana for exploration and visualization, and Logstash as an optional processing layer when a logging environment needs parsing, enrichment, filtering, or routing before logs reach their destination.
Recap: Why Logs Still Matter
It is tempting to think logs become less important once a team has metrics and traces. In practice, logs remain useful because they carry application-specific context that other signals may not contain.
For example, a trace might show that a request to a payment API failed at the charge-card span. A metric might show a spike in 5xx responses. A log line might show that the payment provider rejected the request because of an invalid idempotency key, a missing merchant configuration, or a timeout from a downstream dependency.
Each signal answers a different type of question:
Metrics
-> What changed?
-> How often?
-> How severe?

Traces
-> Where did a request go?
-> Which service or operation was slow?
-> What path did the request take?

Logs
-> What did the application report?
-> Which branch of logic ran?
-> What contextual detail was recorded?

Security Events
-> What suspicious runtime behavior happened?
-> Which process, file, container, or rule was involved?
Good observability is not about choosing one signal and ignoring the rest. It is about using the right signal at the right moment, then moving between signals quickly.
Logs remain especially valuable when debugging business logic, integration failures, unexpected input, deployment regressions, and operational incidents where the application itself knows more than the infrastructure does.
The Problem Centralized Logging Tries to Solve
In a small application running on one server, reading logs from a local file might be enough. In Kubernetes or a cloud-native platform, that approach breaks down quickly.
Pods are created and destroyed. Containers move across nodes. A backend API may run with many replicas. Jobs may exist for only a few minutes. A failed request might involve an ingress controller, an API service, a worker, a cache, a database client, and a third-party integration.
Without centralized logging, engineers end up asking painful operational questions:
- Which pod handled the failed request?
- Did the pod still exist when the investigation started?
- Are the logs split across multiple nodes?
- Can we search logs by service, namespace, environment, or deployment?
- Can we correlate logs with the metric spike or trace we already found?
- How long are logs retained?
Centralized logging gives platform teams one place to collect, query, and retain logs from many workloads.
A basic Kubernetes logging flow often looks like this:
Application Container
-> stdout / stderr
-> Node-level Collector or Agent
-> Central Log Backend
-> Query UI
-> Investigation, Dashboard, Alert
The goal is not just storing text. The goal is making logs searchable, understandable, and connected to the rest of the observability workflow.
What Is Loki?
Loki is a log aggregation backend commonly used with Grafana. It is designed around labels and log streams rather than full indexing of every word in every log line.
That design matters.
In many logging systems, every log message is heavily indexed so users can search across arbitrary text quickly. Loki takes a different approach: it indexes metadata labels, then stores compressed log chunks. Queries usually start by selecting labels such as app, namespace, cluster, or environment, then filtering the log lines inside the selected streams.
A Loki stream is a set of log entries with the same label set. For example:
Labels:
  cluster="prod"
  namespace="payments"
  app="payment-api"
  container="api"

Log Stream:
  2026-05-24T10:15:01Z level=info message="payment request received"
  2026-05-24T10:15:02Z level=error message="provider timeout"
  2026-05-24T10:15:03Z level=info message="request finished"
This makes label design one of the most important parts of operating Loki well. Good labels help narrow the search space. Bad labels create too many unique streams, which increases cost and makes the system harder to operate.
Loki works well when logs are already reasonably structured and when the platform has a clear label strategy. In Kubernetes, common labels often come from namespace, pod, container, app, cluster, and environment metadata.
What Is Grafana?
Grafana is the exploration and visualization layer that engineers commonly use with Loki. It gives teams a way to query logs, build dashboards, create alerts, and move between observability signals.
With Loki connected as a data source, Grafana can be used to:
- Search logs by labels and time range.
- Filter log lines using LogQL.
- Build dashboards showing log volume, error patterns, or service-specific events.
- Create alerts from log queries.
- Correlate logs with metrics and traces.
The correlation workflow is where Grafana becomes especially useful. An engineer might start from a dashboard showing elevated latency, jump to traces for a slow request, then inspect logs for the service and time window involved.
Metric Alert
-> Grafana Dashboard
-> Trace for Slow Request
-> Related Service Labels
-> Loki Log Query
-> Application Error Context
This flow reduces the time spent guessing where to look. Instead of opening five terminals and searching random pods, the engineer follows the evidence across signals.
What Is Logstash?
Logstash is a data processing pipeline that can receive events, parse and transform them, enrich them, filter them, and route them to one or more destinations.
Logstash is more traditionally associated with ELK or Elastic-style logging pipelines, where logs flow through Logstash into Elasticsearch and are explored in Kibana. It is not a mandatory Loki component, and many Loki deployments work perfectly well without it.
That distinction is important.
For simpler Kubernetes logging pipelines, teams often use a collector or shipper that sends container logs directly to Loki. This can be enough when logs are already structured, labels are clean, and the platform does not need heavy transformation.
Logstash becomes more useful when the environment is messier:
- Logs arrive from many formats and legacy systems.
- Teams need complex parsing before storage.
- Sensitive fields must be removed or masked.
- Events need enrichment from external data.
- Logs must be routed to multiple destinations.
- Different teams need different output formats.
In other words, Logstash should be treated as an optional processing layer, not as something every Loki pipeline needs by default.
How They Fit Together
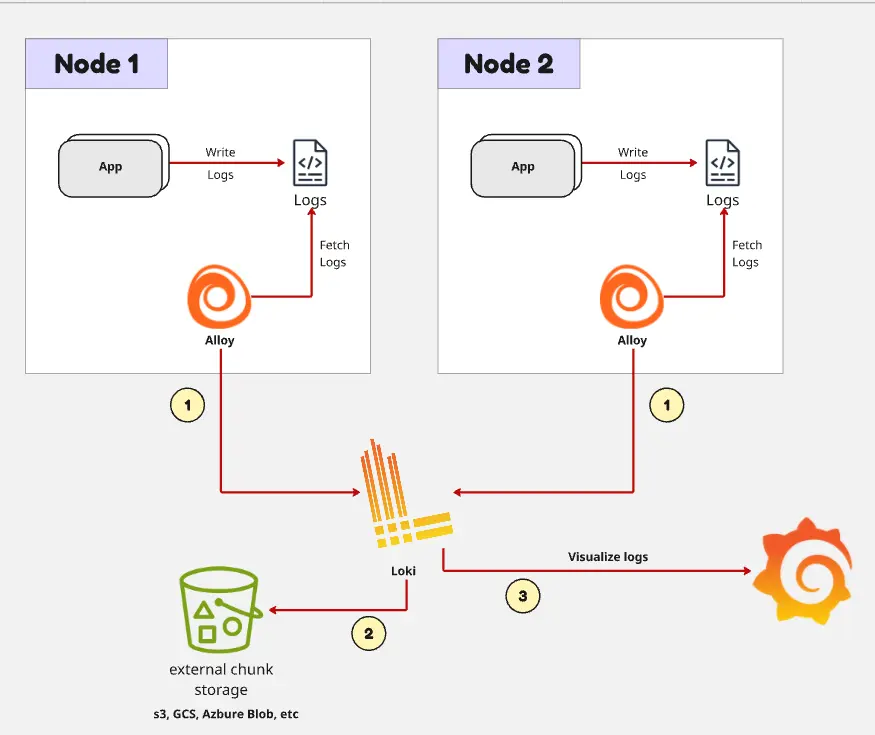
A simple Loki and Grafana logging pipeline can be very direct:
Application Logs
-> Collector / Shipper
-> Loki
-> Grafana
-> Search, Explore, Dashboard, Alert
In Kubernetes, the collector usually runs close to the workloads, often as a DaemonSet on each node. It reads container logs, attaches Kubernetes metadata as labels, and sends the logs to Loki.
When Logstash is added, it usually sits in the processing path before the final backend:
Application Logs
-> Collector / Shipper
-> Logstash
   -> Parse
   -> Enrich
   -> Filter
   -> Route
-> Loki or Another Log Destination
-> Grafana
This can be useful, but it also adds operational cost. Logstash needs compute resources, configuration, scaling, monitoring, and failure handling. A pipeline with Logstash can be more powerful, but it is not automatically better.
The practical decision is this:
- If logs are already structured and only need metadata labels, keep the pipeline simple.
- If logs need serious transformation before storage or routing, consider Logstash.
Core Concepts
The first core concept is structured logging.
Structured logs are easier to parse, query, and correlate than free-form text. A backend service should prefer consistent fields such as level, message, service, trace_id, span_id, request_path, status_code, and duration_ms.
For example:
Good structured log:
level=error service=payment-api trace_id=abc123 status_code=502 message="payment provider timeout"

Harder to query:
Payment failed again, provider seems slow, maybe timeout for request abc123
The second core concept is label design.
Labels should describe stable dimensions that help engineers narrow down logs. Good labels usually have limited possible values. Bad labels have many unique values and create high cardinality.
Good Labels
-> cluster="prod"
-> namespace="payments"
-> app="payment-api"
-> environment="production"
-> container="api"

Bad Labels
-> request_id="req-9f7a2c1e..."
-> user_id="user-839102..."
-> session_id="sess-774992..."
-> order_id="ord-20260524-000912..."
-> ip_address="203.0.113.42"
Request IDs, user IDs, session IDs, order IDs, and other highly unique fields are usually bad labels. They are still useful fields inside the log body, but they should not become Loki labels unless there is a very specific reason and the operational cost is understood.
The third core concept is query workflow.
In Loki, the common query pattern is to start broad with labels, then narrow down with text or structured filters. For example, an engineer might first select logs for app="payment-api" in the payments namespace, then filter for level="error" or a provider-specific error message.
The fourth core concept is retention.
Not all logs need to be retained forever. Debug logs may be useful for a short window. Audit or security-related logs may need longer retention. Payment or compliance-related events may have separate requirements. Retention should be intentional, documented, and aligned with cost.
Practical Example
Imagine a platform team receives an alert: checkout failures have increased in production.
The metric dashboard shows a spike in 5xx responses from the payment service. The traces show that requests are slow around the payment provider call. Now the engineer needs to know what the application reported at the time of failure.
A practical investigation flow could look like this:
Payment Error Rate Alert
-> Open Grafana Dashboard
-> Confirm spike for payment-api
-> Inspect traces for slow checkout requests
-> Copy trace_id or narrow time window
-> Query Loki logs for payment-api
-> Find provider timeout and retry behavior
-> Decide rollback, config fix, or provider escalation
In Grafana Explore, the engineer might query logs for the payment API in production:
{cluster="prod", namespace="payments", app="payment-api"}
|= "provider timeout"
If the application emits structured logs and includes trace IDs in the log body, the engineer can correlate a failed trace with the exact log lines from the same request.
The investigation becomes even stronger when the logs include operational context:
- Which provider was called.
- Which endpoint failed.
- Whether the request was retried.
- Whether the failure was a timeout, validation error, authentication error, or rate limit.
- Which deployment version was running.
The important part is not just having logs. It is having logs that help answer the next operational question.
When Logstash Is Actually Worth It
Logstash is worth considering when the logging pipeline needs more than collection and shipping.
For example, suppose a platform supports several teams:
- New Go services emit JSON logs.
- Older Java services emit multiline stack traces.
- A legacy integration emits custom text logs.
- Security requirements demand masking specific fields.
- Some logs must go to Loki for engineering investigation.
- Other logs must also go to long-term archive storage.
In that environment, a processing layer can help normalize the mess.
Logstash can parse different formats, extract fields, enrich events, remove sensitive data, and route logs to multiple destinations. This is useful when the platform needs consistent log shape across inconsistent sources.
But Logstash should earn its place in the architecture. If the current pipeline is:
Application JSON Logs
-> Kubernetes Metadata
-> Loki
-> Grafana
and engineers can already query logs effectively, adding Logstash may only add another moving part.
The better default is to start simple, improve application log structure, define good labels, and add processing only when the operational need is clear.
Things to Watch Out For
The first thing to watch is high-cardinality labels. Loki depends heavily on label discipline. Labels such as request ID, user ID, session ID, transaction ID, and unique IP address can create too many streams. Put those values in the log body instead.
The second thing is unstructured logs. If every team logs in a different format, searching becomes frustrating and parsing becomes fragile. Teams should agree on a small set of common fields for production services.
The third thing is retention cost. Logs can grow quickly. Debug-level logs from busy services can become expensive and noisy. Decide which logs are worth keeping, at what level, and for how long.
The fourth thing is over-processing. A complex Logstash pipeline can become a production system of its own. It needs version control, testing, rollout strategy, monitoring, and ownership. If the same outcome can be achieved with structured application logs and a simpler collector path, prefer the simpler path.
The fifth thing is poor correlation. Logs become much more useful when they include trace IDs or other correlation fields. If metrics, traces, and logs cannot be connected during an incident, engineers lose time jumping between tools manually.
Closing
Loki and Grafana form a practical centralized logging stack for Kubernetes and cloud-native systems. Loki stores and queries logs around labels and streams, while Grafana gives engineers a familiar place to explore logs alongside metrics and traces.
Logstash can be useful, but it is optional. It fits best when logs need serious parsing, enrichment, filtering, or routing before they reach the backend. Many teams can run a simpler pipeline without Logstash and still get excellent operational value.
The main lesson is to design logging as part of the observability system, not as a dumping ground for text. Use structured logs. Choose stable labels. Avoid high-cardinality fields. Keep retention intentional. Make it easy to move from metrics to traces to logs when production asks a hard question.
In a platform engineering context, centralized logging is not only about searching old messages. It is about helping engineers understand what the system was doing when it mattered.