In the previous observability articles, we moved through OpenTelemetry for collecting signals, Jaeger for tracing requests, Falco for runtime security events, Loki for centralized logs, and Prometheus with Grafana for metrics, alerts, and service health. Those tools help teams see what is happening inside a system. The next question is sharper: how do we decide whether the service is reliable enough for users?
Dashboards and alerts are useful, but they are not the same as reliability goals. A dashboard can show latency, error rate, CPU, memory, queue depth, and database connections. An alert can wake someone up. But teams still need a clear way to measure whether a service is meeting user expectations over time.
That is where SLI, SLO, SLA, and error budgets become useful. They turn reliability from a feeling into a measurable operating model.
Recap: From Observability Signals to Reliability Goals
Observability signals help engineers understand system behavior. Metrics show patterns and severity. Logs show application context. Traces show request paths. Security events show suspicious runtime activity.
Reliability goals use those signals to answer a different kind of question:
- Are users able to complete the important workflow?
- Are requests fast enough?
- Are errors low enough?
- Is fresh data available when users need it?
- Is the service reliable enough for the product promise?
Observability Signals
  metrics, logs, traces, security events
        |
        v
Service Behavior
  success, failure, latency, freshness, durability
        |
        v
Reliability Measurement
  SLI
        |
        v
Reliability Target
  SLO
        |
        v
Engineering Decisions
  ship, pause, fix, scale, simplify
Prometheus and Grafana can help calculate and visualize SLIs. Logs and traces help investigate why an SLO is being missed. The important shift is that reliability goals should start from user experience, not from whatever metric is easiest to graph.
The Problem SLI, SLO, and SLA Try to Solve
Without reliability goals, teams often argue from anecdotes.
One engineer says the service is fine because the pods are running. Another says it is broken because customers complained. A dashboard shows CPU is normal, but checkout requests are failing. An alert fires for memory usage, but users do not notice. Meanwhile, product teams ask whether the system is stable enough to launch a new feature.
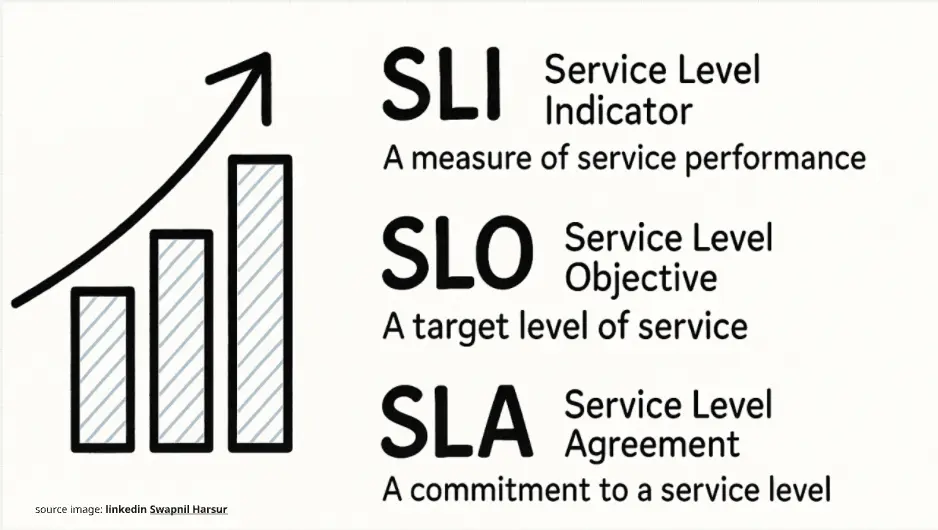
SLI, SLO, and SLA give teams shared language.
- SLI measures what actually happened.
- SLO defines the internal target for how reliable the service should be.
- SLA defines an external or contractual promise, often with business or legal consequences.
They help teams move from vague statements to measurable tradeoffs:
- "The service feels slow" becomes "p95 checkout latency is above 800 ms."
- "Availability was bad this month" becomes "successful checkout requests were 99.82% over 30 days."
- "Should we keep shipping?" becomes "we have burned 70% of the monthly error budget in one week."
This does not remove judgment. It gives judgment better inputs.
What Is an SLI?
An SLI, or Service Level Indicator, is the actual measurement of service behavior. It is the number you calculate from real events.
Good SLIs describe something users care about. They are usually calculated from metrics, logs, request outcomes, synthetic checks, or data processing results.
Common SLI examples include:
- Availability: whether the service can respond.
- Request success rate: percentage of successful requests.
- Error rate: percentage of failed requests.
- Latency percentile: p95 or p99 request duration.
- Freshness: whether data is updated within an expected time.
- Durability: whether committed data remains safely stored.
For a backend API, useful SLIs often come from request behavior:
User Experience
  user submits checkout
        |
        v
Service Behavior
  checkout-api returns success or failure
        |
        v
SLI Measurement
  successful checkout requests / total valid checkout requests
        |
        v
Reliability Signal
  checkout success rate over time
Notice that this SLI is not CPU usage. CPU is useful operational data, but users do not directly experience CPU. Users experience whether checkout works, whether it is fast enough, and whether their order is processed correctly.
Infrastructure metrics still matter. CPU, memory, disk, network, pod restarts, and database saturation help explain why reliability changes. They are usually poor direct user-facing SLIs unless the service itself is infrastructure and the customer experience is tied to that resource.
What Is an SLO?
An SLO, or Service Level Objective, is the internal reliability target for an SLI over a time window.
If the SLI is the measurement, the SLO is the goal.
For example:
SLI
  percentage of successful checkout requests

SLO
  99.9% of valid checkout requests succeed over 30 days
The SLO gives the team a target that is specific enough to operate against. It also creates room for tradeoffs. A service does not need to be perfect. It needs to be reliable enough for the users and business context it serves.
That last part matters. Not every service needs 99.99% reliability.
A payment authorization path may need a stronger SLO than an internal analytics export. A public API used by paying customers may need a tighter target than an admin-only reporting page. A feature in early beta may tolerate more instability than a core checkout flow.
Higher reliability usually costs something:
- More redundancy
- More testing
- More operational complexity
- More careful rollout processes
- More engineering time spent on resilience
- Slower product velocity when error budget is low
The goal is not to choose the largest number that looks impressive. The goal is to choose a reliability target that matches user expectations and business risk.
What Is an SLA?
An SLA, or Service Level Agreement, is an external or contractual promise. It is often made to customers, partners, or another business unit. It may include support terms, credits, penalties, or legal language.
An SLA is usually lower or more carefully defined than the internal SLO. That gap gives the engineering team room to detect problems, respond, and recover before the external commitment is breached.
SLI
  actual measured behavior

SLO
  internal engineering target
  usually stricter than the SLA

SLA
  external customer or contractual commitment
  usually tied to business terms
For example, a team might operate internally against a 99.9% SLO while the formal SLA is 99.5%. The SLO tells engineers when reliability is not good enough. The SLA defines what has been promised outside the engineering team.
SLAs should be written carefully because they affect trust, support, contracts, and customer expectations. Engineering teams should understand them, but they are not only engineering documents.
How They Fit Together
SLI, SLO, and SLA are easiest to understand as a chain.
User Experience
        |
        v
SLI
  what we measure from real behavior
        |
        v
SLO
  the internal target we operate against
        |
        v
Error Budget
  how much unreliability is acceptable
        |
        v
SLA
  external promise, if one exists
The SLI must be measurable. The SLO must be useful for engineering decisions. The SLA must be aligned with business commitments.
A practical example:
- SLI: percentage of successful checkout requests.
- SLO: 99.9% of valid checkout requests succeed over 30 days.
- SLA: customer-facing commitment that checkout availability will meet a formal threshold, possibly lower and legally defined.
Prometheus can calculate the SLI from request metrics. Grafana can show SLO status and burn rate. Alertmanager can notify the team when the error budget is being consumed too quickly. Logs and traces help explain which dependency, route, deployment, or code path is causing the burn.
Error Budget
An error budget is the acceptable amount of unreliability within an SLO window.
If the SLO is 99.9% success over 30 days, the error budget is 0.1% failure over that same window. That 0.1% is not a goal to spend carelessly. It is the tolerance that allows a real system to change, fail, recover, and still meet expectations.
30-Day SLO Window

SLO: 99.9% success
Allowed unreliability: 0.1%

Total valid requests: 10,000,000
Allowed failed requests: 10,000

Successful requests
  9,990,000 or more

Error Budget
  up to 10,000 failed requests
Error budgets are useful because they connect reliability to engineering choices.
If the service is healthy and the error budget is barely used, the team may keep shipping normally. If the error budget is being burned quickly, the team may slow risky releases, prioritize reliability work, roll back a bad deployment, add capacity, fix a dependency issue, or improve failure handling.
This is the practical balance:
- Too little reliability and users lose trust.
- Too much reliability can create unnecessary cost and complexity.
- No reliability target leaves teams arguing from opinions.
- An error budget gives teams a measurable way to decide when to move fast and when to stabilize.
Error budget burn rate is especially useful. A service can be within its 30-day SLO but burning budget so fast that it will miss the target if nothing changes. That is a good time for alerts.
Practical Example
Imagine a Kubernetes platform running checkout-api. The service receives checkout requests, calls payment-api, writes orders to PostgreSQL, and publishes fulfillment events to a queue.
The team chooses a user-facing SLI:
SLI:
  successful valid checkout requests / total valid checkout requests

SLO:
  99.9% of valid checkout requests succeed over 30 days

SLA:
  formal customer commitment, defined separately
  usually lower, narrower, or legally constrained
Prometheus collects request metrics from checkout-api and payment-api. Grafana shows the SLO dashboard. Alertmanager routes notifications when the service burns error budget too quickly.
User submits checkout
        |
        v
checkout-api
  records request outcome and latency
        |
        v
Prometheus
  scrapes request metrics
        |
        v
Grafana
  shows SLI, SLO status, error budget burn
        |
        v
Alertmanager
  notifies team when burn rate is dangerous
One afternoon, the SLO dashboard shows that checkout-api is burning error budget faster than normal. The 30-day SLO has not been missed yet, but the burn rate is high enough that the service will miss it if the trend continues.
The platform engineer checks the dashboard:
- Request rate is normal.
- 5xx errors increased on
POST /checkout. - p95 latency increased before the 5xx spike.
- Database connection usage is normal.
- Queue backlog is stable.
payment-apitimeout errors increased.
The engineer then moves from the SLO view into metrics, logs, and traces.
SLO Burn Alert
  checkout-api consuming error budget too fast
        |
        v
Metrics
  5xx spike, latency increase, dependency timeout
        |
        v
Traces
  slow checkout requests wait on payment-api
        |
        v
Logs
  payment provider timeout for charge operation
        |
        v
Decision
  rollback, fail over, adjust timeout, reduce traffic, or escalate dependency
Metrics show where the symptom is. Traces show the request path. Logs show the application and dependency context. The SLO tells the team how serious the problem is in terms of user-facing reliability.
This is the key difference from a normal dashboard. A graph might show that errors are rising. An SLO view tells the team whether the reliability target is at risk.
Good SLOs vs Bad SLOs
Good SLOs are tied to user experience and engineering decisions. Bad SLOs are often copied from templates, based only on infrastructure metrics, or set to numbers that sound impressive but do not match the service.
Good SLO
  SLI: successful checkout requests / total valid checkout requests
  Target: 99.9% over 30 days
  Why it matters: users can complete purchases
  Decision: slow risky releases if burn rate is too high

Bad SLO
  SLI: average CPU usage below 70%
  Target: 99.99% over 30 days
  Why it matters: unclear user impact
  Decision: unclear, may cause noisy work
Good SLOs usually have these traits:
- They measure user-visible behavior.
- They use an SLI the team can calculate consistently.
- They have a clear time window.
- They support release and incident decisions.
- They are realistic for the service's maturity and business value.
- They can be explained to engineers, product teams, and support teams.
Bad SLOs often have these problems:
- They use CPU, memory, or disk as direct reliability targets without user context.
- They target 99.99% because it sounds professional, not because users need it.
- They measure behavior the team cannot reliably collect.
- They ignore important user journeys.
- They create alerts that do not lead to action.
- They punish harmless infrastructure symptoms while missing real user pain.
CPU, memory, and disk are still important. They help operate the system and explain failures. They are just usually better as supporting metrics than as the main SLO for a user-facing API.
Things to Watch Out For
The first risk is choosing SLOs that are too far from user experience. A service can have healthy pods and normal CPU while users cannot complete checkout. Start from the important user journey, then decide what measurement best represents it.
The second risk is setting every service to 99.99%. Reliability is not free. Higher targets usually require more redundancy, more automation, more testing, more careful deployments, and more operational effort. Some services deserve that investment. Others do not.
The third risk is confusing SLA with SLO. The SLA is an external promise. The SLO is the internal operating target. Teams should usually operate against an SLO that gives them room to protect the SLA.
The fourth risk is building SLOs from bad data. If metrics are missing, labels are inconsistent, or success and failure are not defined clearly, the SLO will create false confidence. Before trusting an SLO, verify that the SLI is measured from the right events.
The fifth risk is alerting on every small SLO movement. SLO alerts should focus on burn rate and real risk. A small, slow budget burn may be acceptable. A fast burn that threatens the monthly target may need immediate response.
The sixth risk is treating SLOs as punishment. SLOs should guide decisions, not shame teams. If a service misses its target, the useful question is what the system is telling us: dependency weakness, missing fallback, risky rollout process, insufficient capacity, bad instrumentation, or unrealistic target.
Useful Reliability Loop

Define user journey
        |
        v
Choose SLI
        |
        v
Set realistic SLO
        |
        v
Monitor error budget
        |
        v
Investigate burn with metrics, logs, traces
        |
        v
Improve service, platform, or target
The loop should make reliability conversations calmer. Instead of arguing whether the service is "stable enough," the team can look at user-facing measurements and decide what action is worth taking.
Closing
SLI, SLO, SLA, and error budgets give observability a reliability direction. Metrics, logs, traces, and dashboards show what happened. Reliability goals help teams decide whether what happened is acceptable.
An SLI is the measurement of real service behavior. An SLO is the internal target the team operates against. An SLA is an external promise, often tied to business or contractual terms. An error budget is the amount of unreliability the team can tolerate while still meeting the SLO.
For platform and backend teams, this is where observability becomes more than graphs. Prometheus and Grafana can show whether services are meeting their reliability targets. Alertmanager can route risk at the right time. Logs and traces help explain why the target is being missed.
The practical goal is not perfect reliability everywhere. The goal is reliability that matches user needs, business risk, engineering capacity, and product velocity. Good SLOs help teams make those tradeoffs with evidence instead of guesswork.